Viability of a Dockless e-Bike Fleet Operation in Reykjavík
December 11, 2018
This paper is an investigation of the viability and scale potential of operating a privately owned fleet of electric bikes in a dockless system, wherein users locate available bikes with an app and pay per trip.
I conclude that not only is the global urban mobility sector being disrupted by a propagation of LEV’s (light electric vehicles) but that a local e-bike fleet operation in Reykjavík is cash flow positive within 12 months and can grow to 250 to 400 bikes and a valuable business within three years.
Mobility in Reykjavík
Urban mobility in Reykjavík is dominated by personal cars accounting for 73% of all trips according to survey data from September 2018. In a Eurostat 2017 survey Levkosia in Cyprus was the only other European city where the modal share of cars was above 75%. In large cities in the EU, 49% of people use public transport to commute. In Reykjavík the share of trips using public transport is only 4%. The share of bike trips has however grown nine-fold since 2002 and accounts for 7.0% of all trips, according to the modal split survey from September 2018.
The city faces mobility, environmental and health problems due to heavy, dense and slowing car traffic. It intends to solve by investing in a higher-service public transport option and more biking infrastructure. Steps have been taken by city authorities in the capital area to develop public transport with more carrying capacity between the key urban centers across Hafnarfjörður, Seltjarnarnes, Kópavogur and Reykjavík. Construction of priority bus lanes is expected to begin in 2019 ("Bus Rapid Transit").
The City of Reykjavík is investing 240m to 250m ISK a year on bike paths. The amount of bike paths put down is not available, but according to my sources this data will be put together soon by the city.
Micromobility
The term "micromobility" has been used to refer to the adoption of light electric vehicle technology. A key analyst of the sector, and coiner of the term is Horace Dediu (@asymco on Twitter). His definition of the segment is vehicles weighing up to 500 kg. I will refer to vehicles fitting this description as LEV’s (light electric vehicles). Micromobility refers to the technological adoption.
Physics
The physics of LEV’s are key to their disruptive potential. Compared to cars, LEV’s are less safe, less comfortable, slower, have less range, have slower max speeds and are less powerful. But they are improving rapidly and currently serve a segment ignored by incumbents; the low end. These are all classic traits of disruptive technology. Let’s take a closer look at their transport fundamentals.
The power output of a "healthy male" during an hour of cycling exercise is 200W. A an e-bike with motor output of 250W would double the total power output. Because the vehicle is light compared to its power output, and because the aerodynamic resistance doesn’t impact slow speeds, the vehicle is extremely efficient at transporting a rider.
Cars on the other hand are inefficient because they are heavy compared to their payload. Cars have evolved to maximize comfort, top speeds and safety. The combination of speed and safety has demanded materials to minimise damage of impact to passengers at speeds exceeding 90 km/h. A significant number of trips don’t ever exceed 50 km/h or carry more than one passenger however. The energy required to power a 1,500 kg vehicle is significant. It must either use imported energy dense liquid fuel or extremely large batteries. The Tesla Model 3 has a base configuration battery weighing 480 kg with a range of 350 km. A high range e-bike battery pack weighs only 4.8 kg but has a single charge range of 180 km. That’s half the range at a hundredth of the weight.
Not only are LEV’s efficient vehicles, but the road infrastructure can pack much higher bandwidth of transport per square meter of land. The roads are narrower, cost much less to construct (only 1/10th by some estimates) but have higher transport bandwidth still. One estimate is 2,000 cars vs 14,000 cycles on narrower lanes.
Hardware
The three most common vehicles in dockless micromobility fleets are bikes, e-bikes and scooters.
Design iteration cycles for LEV’s are very short. The time between Lime gen 2 scooters and gen 3 was six months. A traditional car goes from "concept phase to sales floor" in 2-5 years.
Examples of the dimensions of improvement for LEV’s in the past 12 months:
durability to increase lifespan and reduce maintenance cost,
comfort of ride (better wheels, suspension and braking systems, brighter displays etc.),
core component upgrades such as increased battery density and motor innovations,
finish and design (cabling, materials etc.).
The estimated vehicle lifetime of the scooters from Ninebot operated by Lime and Bird are hard to pin down, perhaps as it is still not determined by operators and varies by city (the newest vehicle model is only a few months old). Three key factors affect lifetime: build quality, vandalism and theft rates. It has been reported that heavier vehicles experience lower vandalism and theft rates (presumably because they are more difficult to carry around by a human).
Pedelecs are a fast growing segment of micromobility both in fleets and retail. Pedelec e-bikes use torque sensors to inject additional power as the rider applies their own power to the pedals. The torque sensors are tweaked for an intuitive rider experience to simulate what can be described as a "superpower" of the user. This makes the bike intuitive in operation as it rides much like a regular bike, just faster.
Pedelecs are classifed according to power output with two categories.
| Name | Power | EU Class | Iceland Class | Speed |
| Pedelec | 250w maximum | L1e-A | Létt bifhjól flokkur 1 | 25km/h max |
| S-Pedelec | 250w+ | L1e-B | Létt bifhjól flokkur 2 | 45km/h max |
*I will refer to s-pedelecs or pedelecs.
The two categories of pedelecs are both growing segments in retail sectors (where bikes are intended for private ownership, not fleet management). In Holland, one of the most mature s-pedelec markets I project sales to have grown by 20% in 2018 based on reported sales volume for January to November, at 2405 units already sold for that period.
Manufacturers of motors suitable for pedelecs are expanding, with car component manufacturers jumping into the segment (General Motors, Brose, ZF). Industry research indicates 6% annual growth of e-bike motors.
Beyond s-pedelecs are e-mopeds which still classify as micromobility vehicles; vehicles that may find strong markets where mopeds are already popular. There are many cross-category experiments and innovative three-wheeler designs within the LEV segment. If vehicles are rented for single trips, each vehicle has the potential to be customized for that specific job — with different cargo options, safety features, sheltering and comfort features.
Service
Although the retail segment for LEV’s is growing, most of the growth is with per-ride rentals operating dockless fleets of electric scooters, bikes and e-bikes. The dockless technology, wherein users locate and unlock bikes using an app, was invented in China. Lime, the largest fleet operator of LEV’s is reported to be the fastest growing company in the history of business. Both Uber and Lyft have invested in dockless fleet operators and integrated LEV options into their core offering.
LEV’s are slim and compact but can still burden cities if the concentration of vehicles is too high. Many cities have adopted a system of rental permits to allow only a capped number of vehicles deployed. Some cities, namely in China, were initially slow to react to the adoptions of dockless bikes and became victim to a volume war between providers. Fleet operators tried to pump trip numbers by increasing the density of low-cost vehicles. Such dynamics are no longer playing out with higher unit cost of electric vehicles and city permits with managed fleet sizes.
To assess health of fleets cities and investors should look at:
Trips per day per vehicle (TDV)
Maintenance cost
Vehicle lifetime
Trip distance average and distribution
Cities also want to ensure vehicles are in good shape and don’t become "zombies" when they get dropped off in low-demand areas. They may also want to ensure or monitor a service threshold for areas that are underserved by public transport.
Market
Lime and Bird are companies that have popularized the usage of scooters in many US cities. Scooters are controversial and the fleet operators, many heavily VC funded, are still grappling with unit economics. On the other hand, many cities are embracing them and user adoption is ramping up fast.
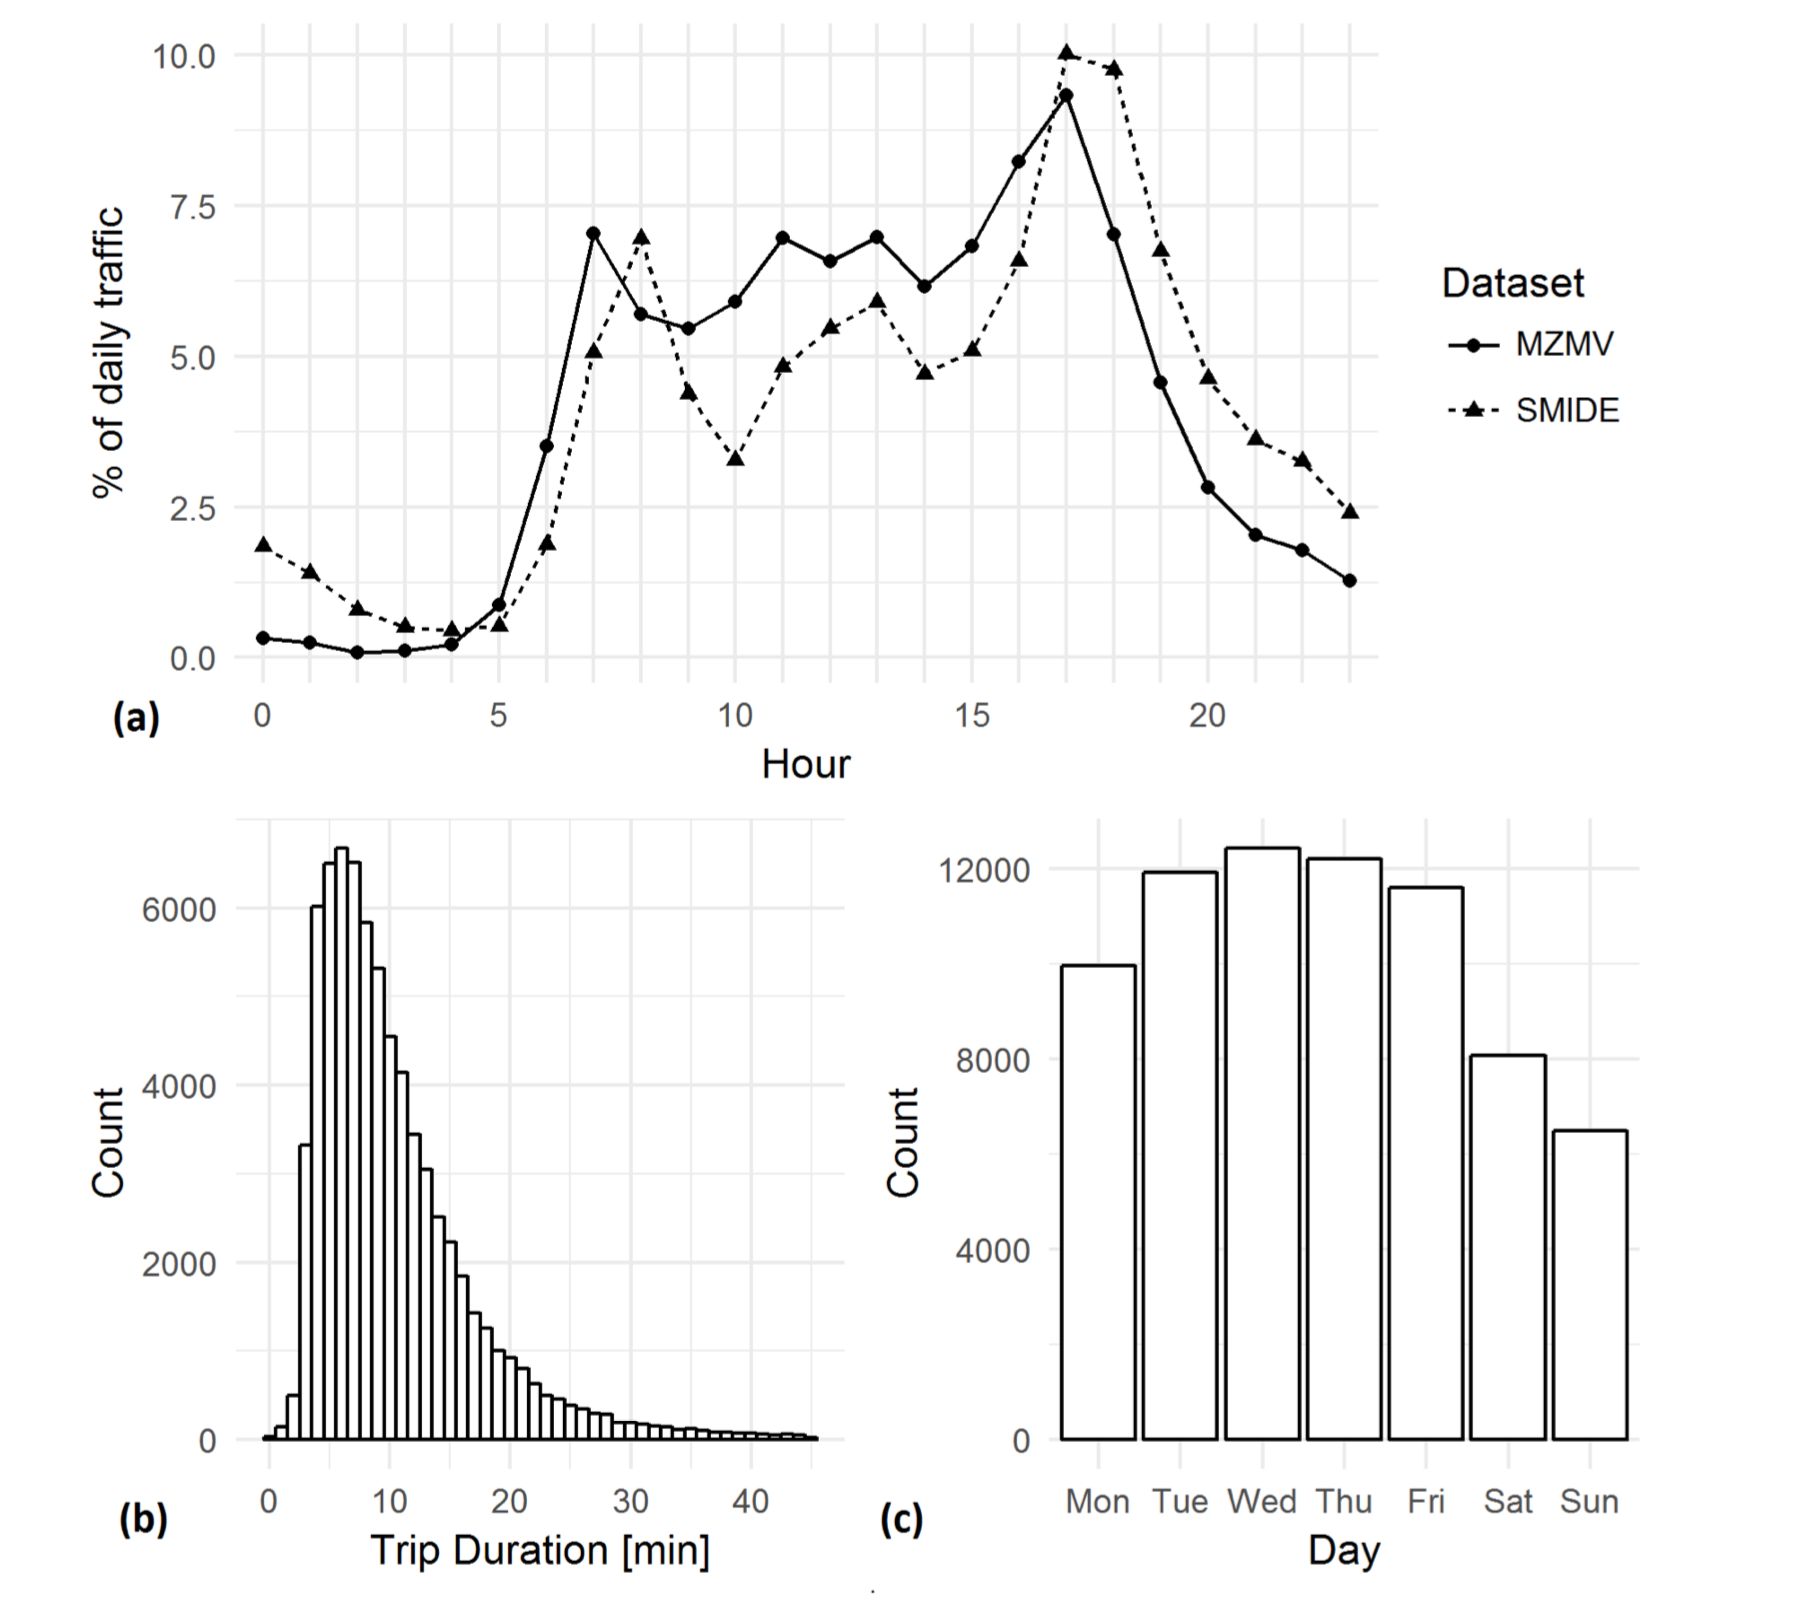
What trips are micromobility solutions competing for? A research paper using eight months of trip data from one of the few s-pedelec dockless operators, Smide in Zurich, reveals some interesting insights.
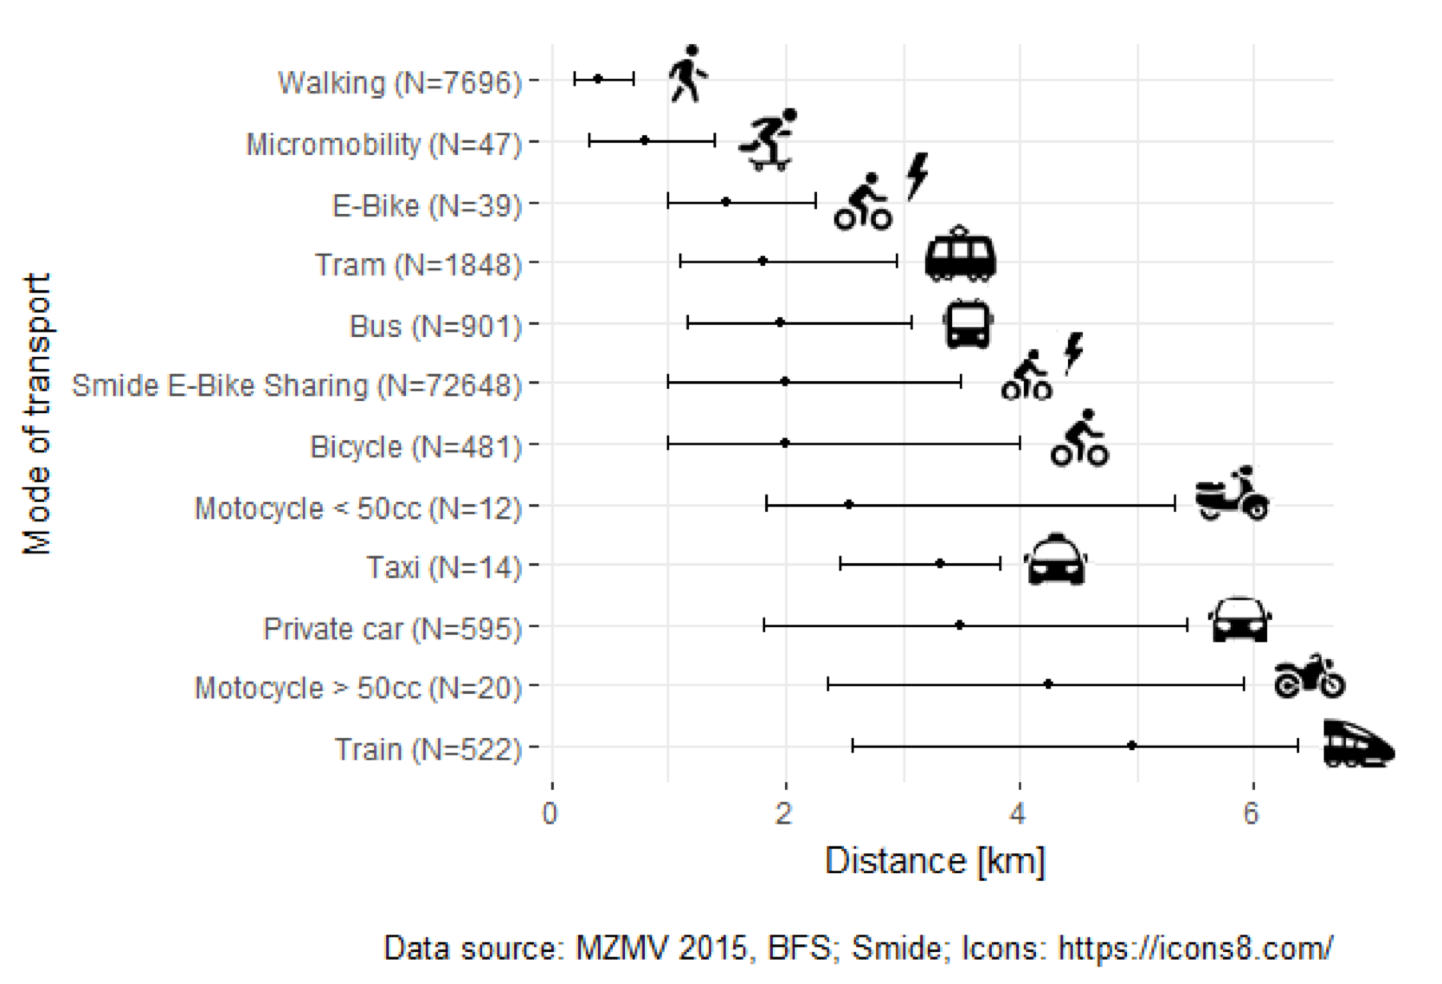
Smide’s s-pedelecs compete with public transport, other electric bikes, regular bikes and a good amount of private car trips. Zurich has a very high penetration of public transport trips, so in Reykjavík car trips probably have a lower boundary in the distance quartiles, meaning s-pedelecs can potentially service more car trips in Reykjavík, and fewer public transport trips.
Smide has reported on Twitter that since this research was published their fleet now gets more utility per vehicle and covers longer distances. This means they are eating even more of the car’s lunch.
Significant adoption increase during the period of data sampled, and the fact that it was only for the period of April to November, means that seasonality could not be assessed.
Micromobility will also induce new demand by introducing new trips. I have identified a few factors with potential to induce new demand:
Joyrides: trips on fast bicycles are enjoyable, social and fun
Ownership: access to infrastructure mainly intended for heavier vehicles is now available to all, not just to those who own a car or a motorbike
Logistics: the ability to be able to leave the vehicle behind and only complete one leg of a trip, can encourage people to complete more trips (for example if you want to consume alcohol at the destination, you only need one taxi ride, not two)
However ... we must acknowledge that converting someone who has already purchased a "bundle" of trips upfront by acquiring a car for private use is difficult except for one-off trips where a rented single-trip vehicle works better. Households with a car at their disposal will in most cases opt for this vehicle for their trips for as long as that vehicle is available.
Micromobility can help delay or avoid car ownership, especially for secondary vehicles at a household. These trends are not observable today because it’s still early days, but they are already observable in cities where public transport or bike infrastructure is correlated with fewer cars per household.
Few city municipalities have conducted thorough modality shift studies after large dockless e-bike deployments. This would give concrete evidence of the benefits, and how many car trips cities can expect to convert to bike trips. A questionnaire from The Portland Bureau of Transportation suggests that 34% of scooter trips replaced car trips, a promising indicator.
UBER has shared preliminary data of modal shifts after introducing the Jump e-bikes as an option (10% shifting from car trips to cycling-only trips), and Mobike has published surveys from their user base in Shanghai where people claim to be switching from car to bike trips. These statistics are not as concrete as city modal data based on real life measurements however.
Concept
I propose an initial fleet size of 40 s-pedelecs in the most densely populated area of Reykjavík. Available bikes can be located in an app that is freely available to both locals and tourists.
Riders are insured by the fleet operator for every ride. They are required to have a license to operate Category II vehicles (a normal driver’s license will do). They are required to wear a helmet which comes with the bike.
According to a Stromer sales rep a fleet operator should assume about one mechanic for every 200 bikes to handle maintenance and repairs. One other full time staff rebalances the fleet, relocates bikes from low demand to high demand areas using a dispatch van. An outfitted bike workshop with staff facilities is needed to service hardware and charge batteries during the night.
Stromer claims that the overcapacity of batteries needs to be around 25%. The range of batteries is 100 km and need to be charged every 2-4 days depending on use (usually due to seasonality). Battery swaps are done by charging standalone batteries during the night and shipping warm batteries out during the day to swap cold batteries for warm ones. The Stromer bikes have swappable batteries locked and unlocked with a physical key.
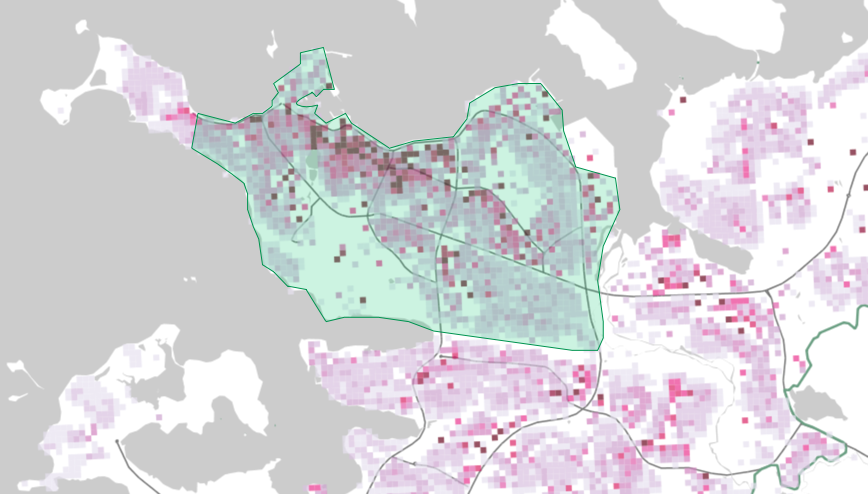
Service Area, Phase 1
30 bikes.
Included
| Neighborhood | Area km² | Population |
| Vesturbær | 2.9 | 15,703 |
| Miðborg | 3.6 | 8,618 |
| Hlíðar | 3.3 | 9,612 |
| Laugardalur | 6.4 | 15,239 |
| Háaleiti og Bústaðir | 4.3 | 13,755 |
| - | 17.2 | 62,927 |
Excluded
| Neighborhood | Area km² | Population |
| Breiðholt | 5.5 | 20,646 |
| Árbær | 6.1 | 10,192 |
| Grafarvogur | 14.0 | 18,130 |
| Kjalarnes | 61.7 | 834 |
| Grafarholt og Úlfarsárdalur | 22.5 | 5,416 |
| - | 109.8 | 55,218 |
The capital area includes these connect municipalities which are potentially included with a single dockless fleet in later phases.
| Municipality | Population |
| Kópavogur | 33.430 |
| Hafnarfjörður | 27.960 |
| Garðabær | 14.440 |
| Mosfellsbær | 9.350 |
| Seltjarnarnes | 4.410 |
Usage
The financial model is sensitive to fleet investment cost, the TDV (trips per day per vehicle) and average trip time length. Bike investment is around 1m ISK per vehicle and based on various sources I have confirmed that TDV for Stromer in Zurich is between 3 and 9 depending on climate, with rain having more impact than snow.
According to a Smide representative, their Stromer bikes in Zurich last four years at an average of eight trips per day per bike. Smide was started in 2015, whereas Lime was founded in 2017, so they have real world experience. They claim low vandalism and theft rates. In Reykjavík the WOW bike representatives have also reported zero vandalism cases. There is reason to believe Reykjavík is a city supportive of low theft and vandalism rates.
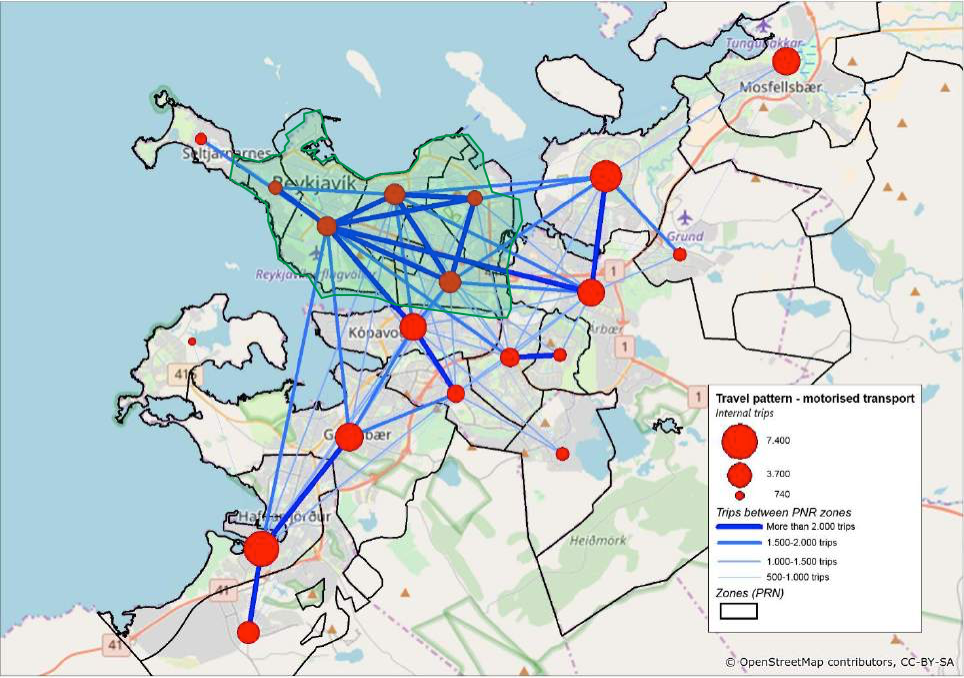
Reykjavík Market
One way to look at the current addressable market in Reykjavík is to consider single-passenger trips in urban settings below 10 km in total trip length with only one occupant.
The number of car trips per day in the Reykjavík capital region is in the excess of 850,000. According to data from The US Federal Highway Administration nearly two-thirds of car trips are under 10km (57.6% of car trips are under 8 km long). I have not been able to come by distance distribution data in the capital region, but an average . In a 2010 UK survey the rate of commute-or-business related car trips with only one occupant was 86%.
An estimate based on these numbers gives us 450,000 car trips per day — i.e. trips under 10km distance with a single occupant traveling within the capital area.
This geofence includes many large hotels, tourist accomodation and popular Airbnb apartments. This is also an area with many large employers and workplaces and a concentration of commuting and trips during the workday.
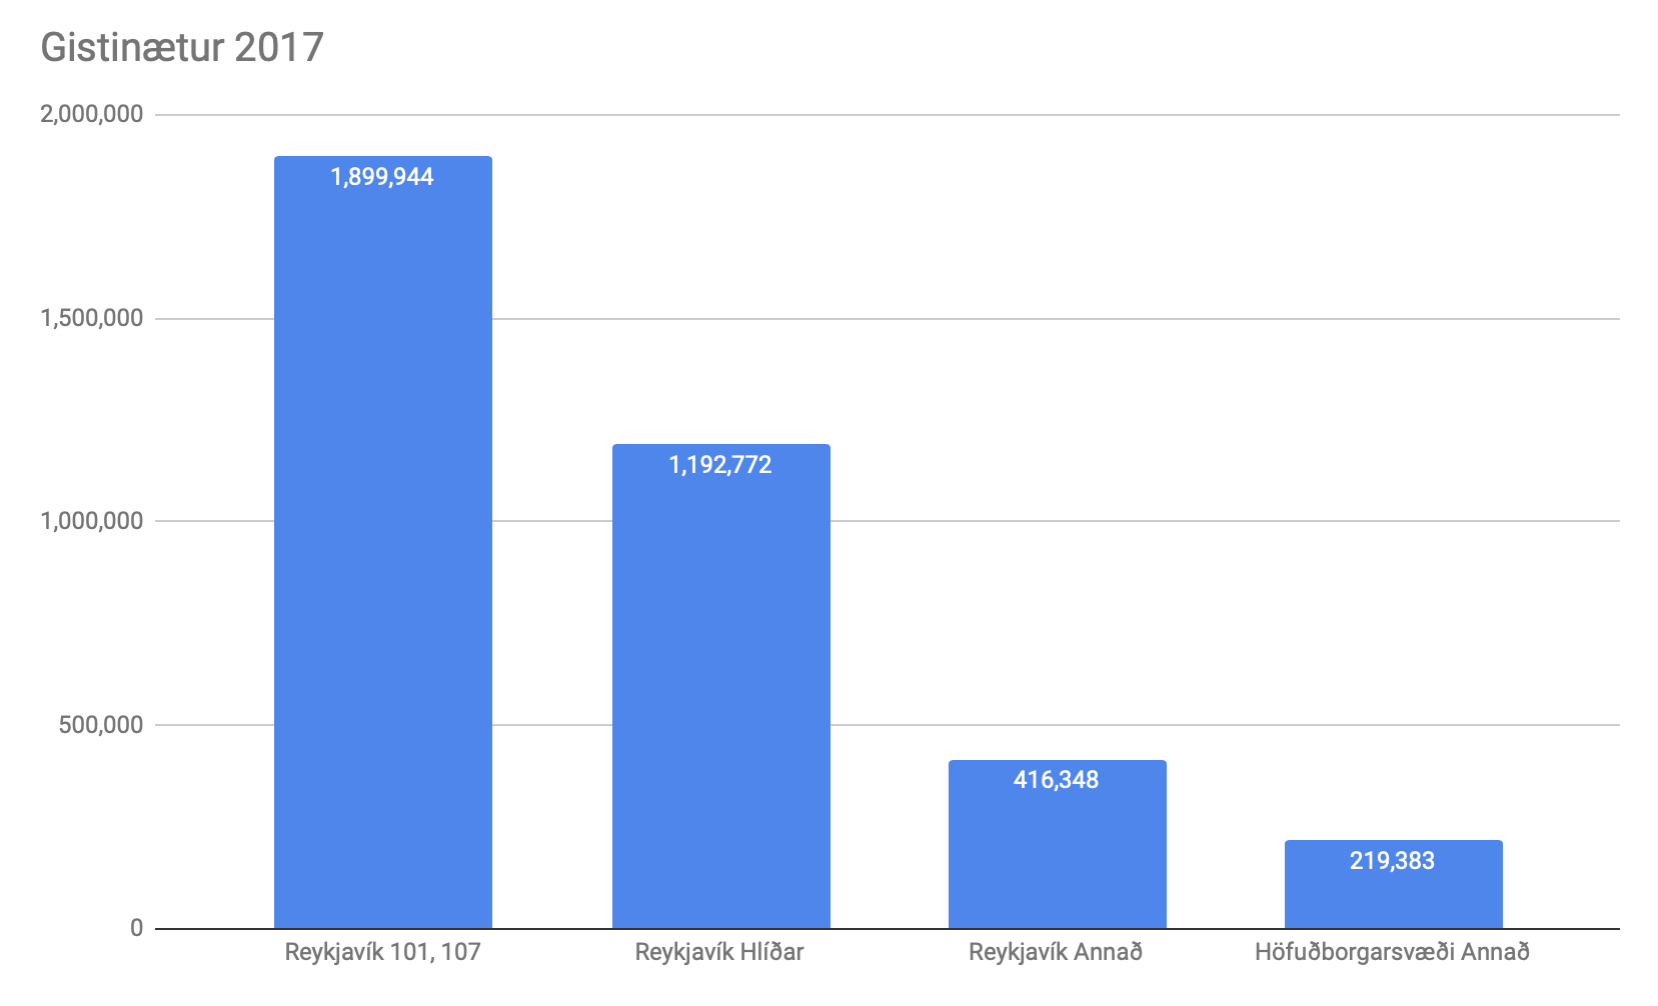
The concentration of tourist accomodation in the service area will give a more accurate population number. The service geofence captures at least 83% of all accomodation in the Capital Area (3,092,716 accomodation nights in zip codes 101, 107 and 105 for the year 2017). If we consider this part of the user base we can assume 8,473 users on top of the 63 thousand habitants in this area. My adjusted population number is 63k.
Commuting patterns have not yet been analyzed, but this is an area with the biggest private and public employers in Iceland and there are traffic patterns showing lots of activity into and within the geofence.
Finance
I have put the annual average at 5 trips per day, with a linear 12 month adoption curve (going from 0 to 5 trips).
Pay as you go: 80 ISK per minute
Subscription: 12,000 ISK per month (includes 20 minutes riding per day)
At 5 trips per day revenue per bike is 96,000 ISK per month. The vehicle lifetime is around 4 years, or 4.6m ISK. Credit card fees are around 3%. The vehicles and its riders are legally required to be insured, a cost incured by the operator. Insurance must be negotiated, but should not exceed that of a car (my estimate is 50,000 a year per vehicle). This gives us net annual revenue flow from vehicles of 3.419.760 ISK, but doesn’t cover servicing or replacement vehicles in the case of damage beyond repair.
Usage and vehicle lifetime are of course dependent variables.
Projections
5 trips per day per bike (projected)
| Year | Bikes | Revenue | Opex | EBITDA | Capex |
| 1 | 40 | 34m | 36m | -2m | 42m |
| 2 | 100 | 124m | 48m | 76m | 65m |
| 3 | 250 | 301m | 64m | 238m | 76m |
| 4 | 250 | 301m | 64m | 238m | 6m |
4 trips per day per bike (conservative)
| Year | Bikes | Revenue | Opex | EBITDA | Capex |
| 1 | 40 | 27.9m | 35.8m | -8.0m | 42.4m |
| 2 | 100 | 100.7m | 47.3m | 53.4m | 64.5m |
| 3 | 250 | 244.1m | 63.2m | 180.9m | 159.2m |
| 4 | 250 | 244.1m | 63.2m | 180.9m | 4.6m |
6 trips per day per bike (optimistic)
| Year | Bikes | Revenue | Opex | EBITDA | Capex |
| 1 | 40 | 40.2m | 36.0m | 4.1m | 42.4m |
| 2 | 100 | 146.7m | 48.1m | 98.7m | 64.5m |
| 3 | 250 | 359.3m | 65.2m | 294.1m | 159.2m |
| 4 | 250 | 359.3m | 65.2m | 294.1m | 4.6m |
In all cases travel time, on a pay-per-minute pricing structure, is 8 minutes. The model is highly sensitive to trip time too.
Model Caveats
At the end of year four vehicles from year one will be at the end of their lifecycle and capex would go up again to replace them or expand the fleet.
One important caveat of the model is the adoption of new bikes added in years 2 and 3. It is crudely assumed they get 5 trips per day. In reality when there are too few bikes there should be more trips per day, and for that number to fall when a big batch of new bikes is introduced.
Competition
WOW air operates, in partnership with Reykjavík, a docked non-electric bike rental. The fleet size is 100 bikes in eight stations. No bikes have been lost and vandalism has been minimal according to operator reports. In the month of August, their busiest month, there were 2,600 trips recorded—a 10% increase from August in the previous year. This is less than one trip per bike per day but similar docked non-electric bike systems in achieve 2.5 to 5.3 rides per day per bike.
It is suspected, from sampling data from the WOW air fleet, that stations are not just too few and far apart, but are not being rebalanced during the day. This means there are frequently either full stations at intended destinations or empty stations at the departure point. Bikes must be returned within 30 minutes of initiating the ride without incurring additional charges, a policy designed to incentives shorter rides, but this may be impractical since full stations cannot be relied upon for bike returns.
The expectation is to get ~10x as many rides per bike as WOW at comparable prices (WOW air bikes are 350 ISK per ride). This is due to
shorter distance to bike
superior comfort and speed
ability to park closer to trip destination
larger servicing area
Ultimately the real competition in the capital area is car ownership.
FAQ’s
Why dockless?
I see dockless free floating fleets as an iteration and improvement upon the docked fleets, not an alternative. Dockless bikes do not require land provisions from the city, allow more pickup points close to the customer, and allow the customer to park much closer to their destination. The growth of dockless fleets is much faster and the bikes get more trips per day.
Why s-pedelec (category II e-bike)?
Electrification is rapid and justified by unit economics. Electric fleets are achieving more rides per day per bike which more than justifies the capital requirements.
The scooter wars between Bird and Lime are happening in cities where the modal split for bikes is only around 1%. The scooters are not taking away car trips but letting people "walk faster" shorter distances. In Los Angeles survey data reveals that
Category II vehicles are not allowed on bike paths and walkways — those are intended for traffic up to but not exceeding 25 km/h. This makes it hard to compete in distance and speed with cars and public transport. My proposal is to look at the bike not as a bike, but simply as a user friendly vehicle in Category II, intended to use among cars on 30 km and 50 km infrastructure. This is the infrastructure that receives the most funding and has the most bandwidth today. Later it is easy to imagine regulation change where a "third" micromobility "green" lane will be used for mixed LEV traffic and bikers who like to go fast.
What about larger LEV’s? One other vehicle could be interesting in Reykjavík; a bulkier e-moped. These vehicles are popular in many cities already, but not in Reykjavík. I believe s-pedelecs, as counterintuitive as it is to exclude a bike from shared sidewalks and bike infrastructure, is basically an e-moped in disguise. Already many experienced bike people are preferring to ride in traffic. The increase to almost-double-digit modal split of bikes is a trend I want to ... ride.
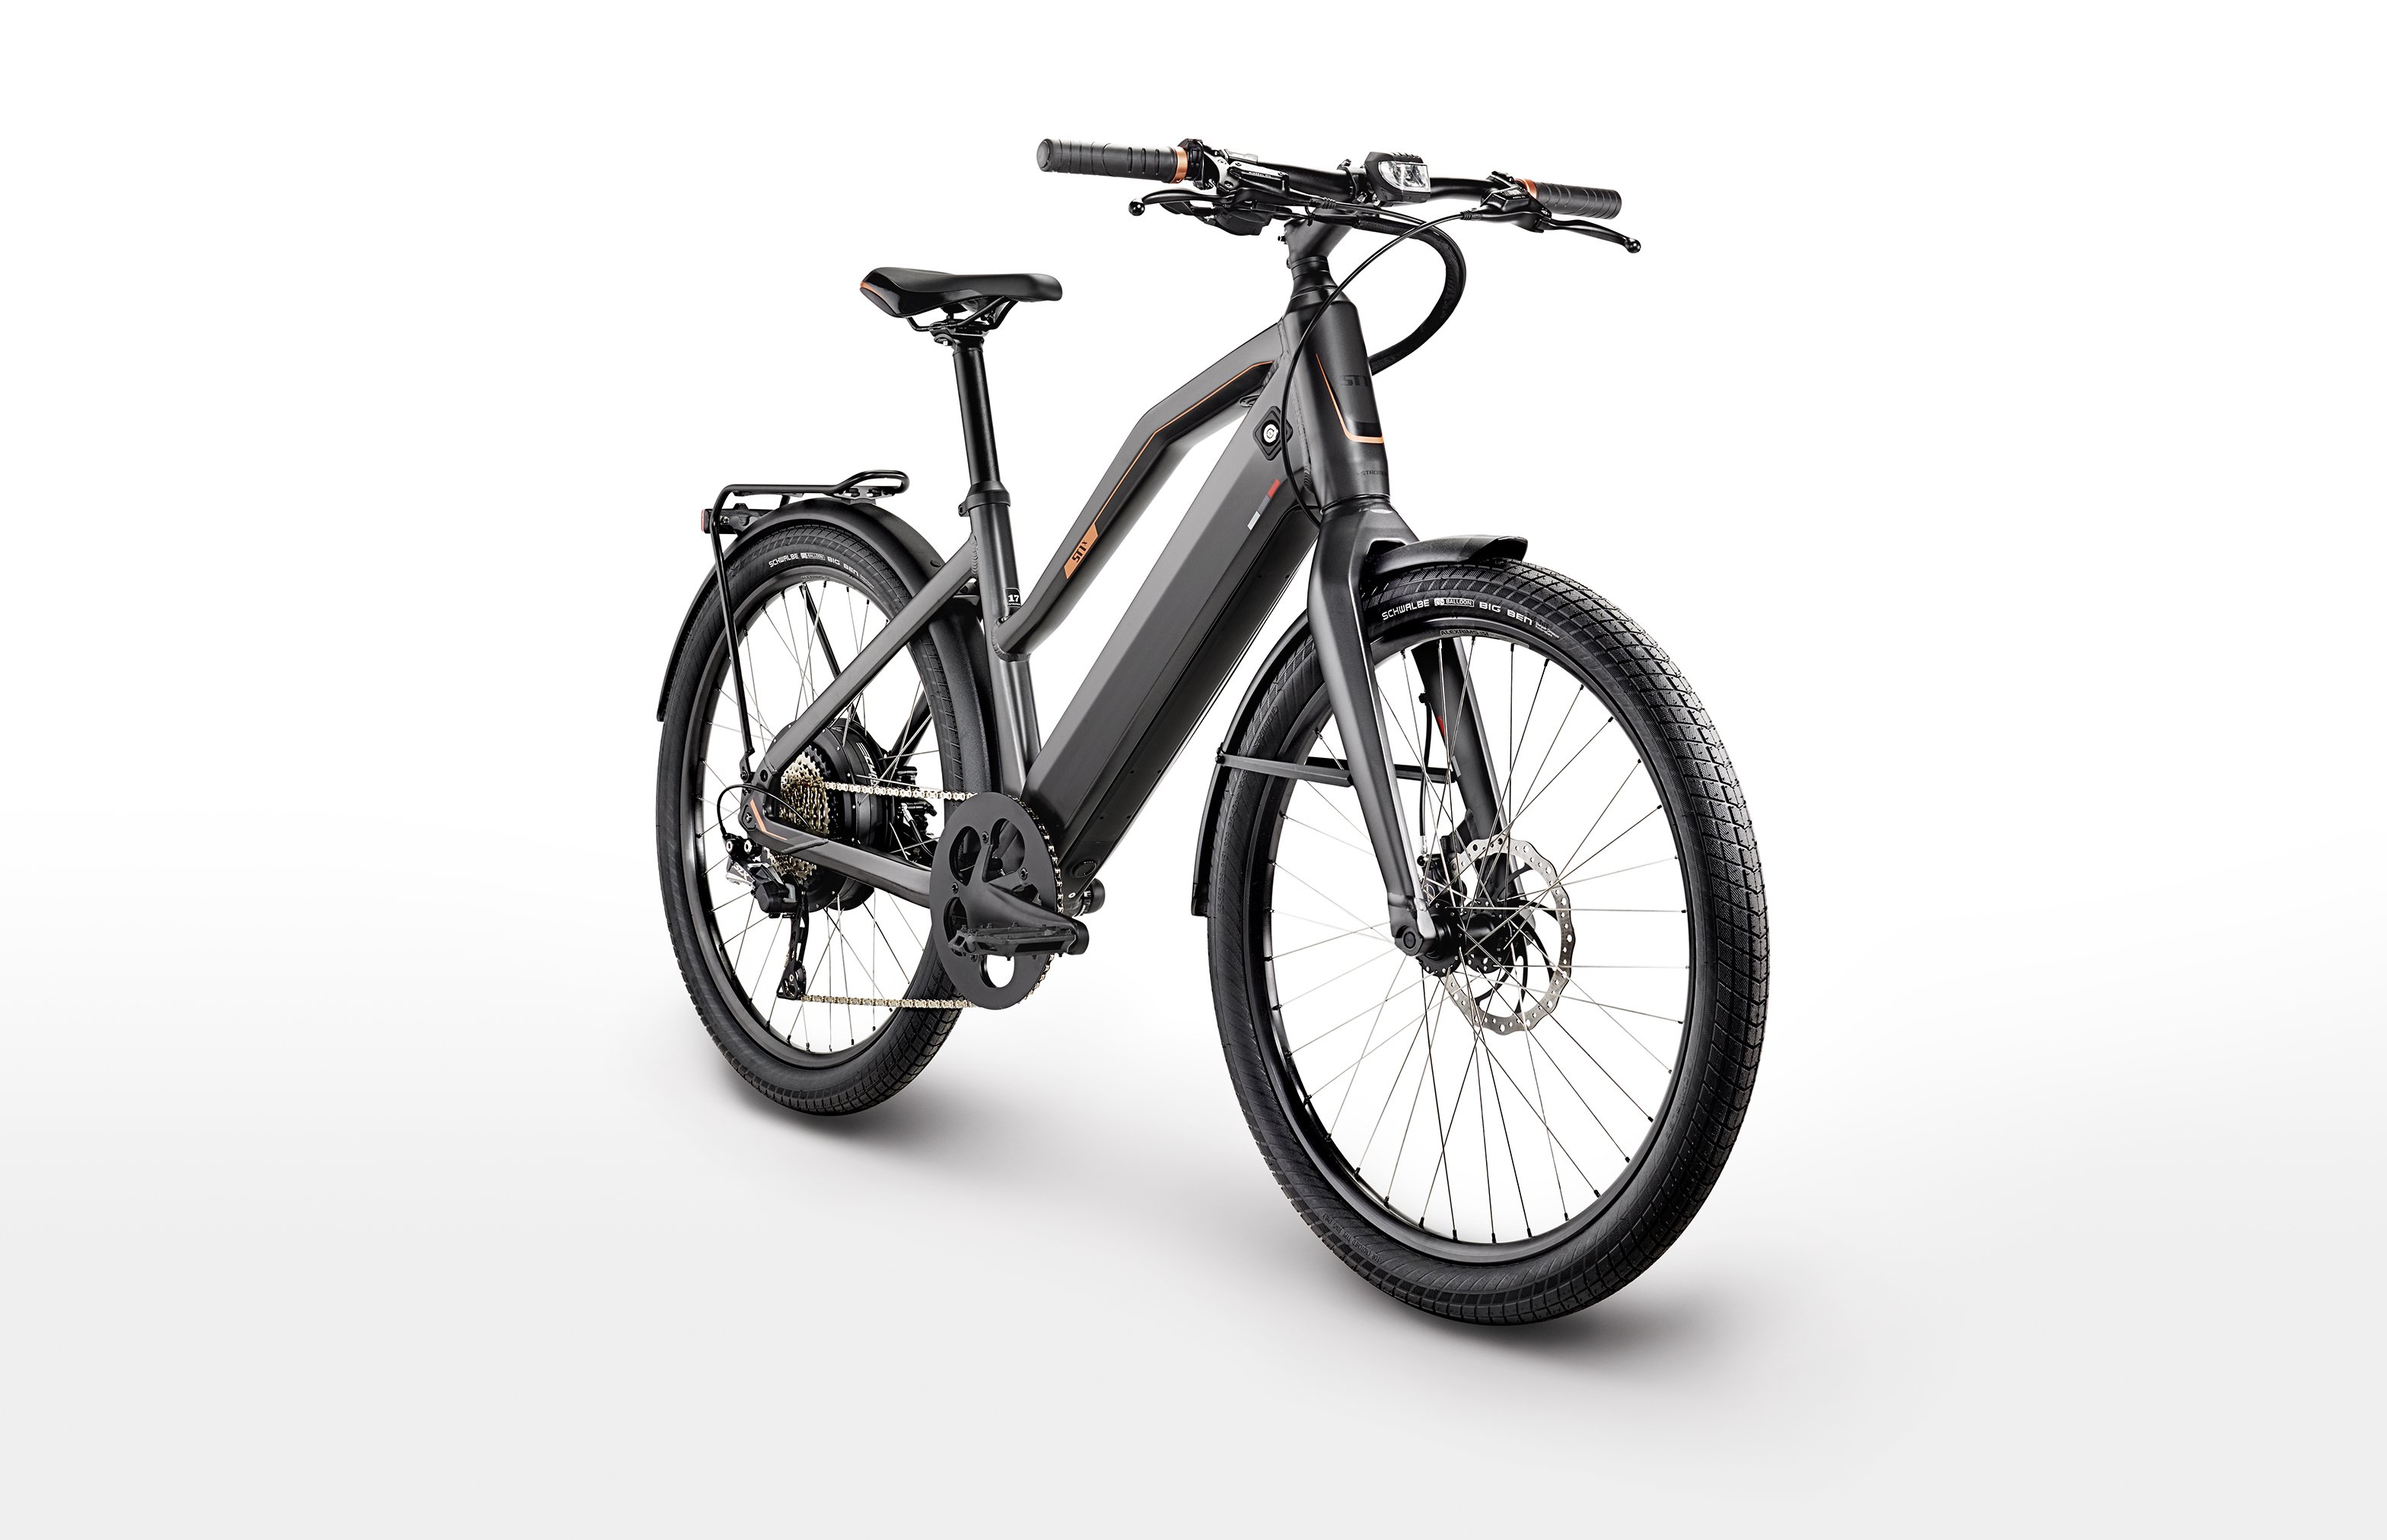
Why Stromer?
Stromer bikes have integrated GPS and GSM hardware, along with a contracted SIM card to make the vehicle globally trackable via the manufacturer. This means the bikes are "fleet ready" from the manufacturer and can easily be integrated into transport apps such as Transit or Moovel. The upfront integration cost is therefore much lower.
The vehicles are about 3-4x as expensive as Chinese bikes of similar power, but Stromer is the only bike the comes with an API to locate and communicate with the bike motor; an API that can be used to lock, unlock, collect data and set configurations per-ride such as max speed. So the integration cost is simply bundled into the bike cost. Since this is a small fleet it is better to de-risk the investment, minimise development cost and use Stromer bikes.
There are other s-pedelecs but they don’t have a service layer that fleets can leverage included. For regular 250W pedelecs there exist startups such as Superpedestrian and Joyride who provide a fleet management stack "out of the box, everything but the bike". This includes trackable bluetooth locks and software to manage fleets.
Some people call Stromer the Porsche or Rolex of bikes. These are comments meant to express the extravagance, perhaps ostentatious nature of Stromers. They retail for €6,000-€10,000. My interpretation of the bike is that it is certainly a high end bike, but that the high upfront cost is recouped on three different dimension:
Operation cost is lower: The vehicle lasts longar and the build quality is such that it requires less maintenance.
Integration cost is lower: Bikes have an integrated service layer so app development is quicker and fleet features are built in.
Revenue per bike is higher: My aim is to at least 10x the WOW air revenue. Faster vehicles of good quality attract more consumers, more trips and people are willing to walk further.
What about safety?
A 2015 survey from Gothenburg gives an idea for incident frequency and the nature of accidents on e-bikes.
A total of 410 trips, covering 1474km over 86h, was collected in this study. Average speed was 16.9km/h (SD = 2.9 km/h), and average trip duration was 14.0 min (SD = 5.0 min) across the 12 bicyclists in the analysis. Fig. 2 shows how the trips were spread geographically in the Gothenburg area. Table 2 describes the collected data for each bicyclist. The distribution of critical events was as follows: four bicyclists experienced two to four critical events, four bicyclists experienced six to nine, and four bicyclists experienced more than nine (Table 2). Of the 88 critical events, four were iden- tified as crashes with degraded stability (i.e. the rider hit some object and lost stability, but was able to recover and did not fall) and the remaining as near-crashes. The most common conflict was with pedestrians (31% of the critical events; Fig. 3), light vehicles (21%), and bicycles (18%). Conflicts with heavy vehicles and animals were rare, 8% and 6%, respectively. In 9% of the critical events the bicyclist did not have a conflict with any road user but with the infrastructure (e.g. a pothole in the bicycle lane). Finally, in 7% of the cases no clear conflict (i.e. a clear threat to the bicyclist at a specific time and place) was identified. In a very common example, bicyclists claimed that darkness triggered the critical event. As darkness on the road was often present for much of the whole trip, conflict was classified as none.
Regular pedelecs are intended for shared sidewalks with mixed pedestrian, cycling and other Category I LEV traffic. No official survey has been identified that measures incident rate for s-pedelecs who share infrastructure with larger motor vehicles such as cars.
In a podcast interview a representative from Smide shared some insight from their experience with s-pedelecs in Zurich. The rep disclosed that s-pedelecs had been capped at 30 km/h speeds at the request of the city. A low incident rate has now resulted in the max speed now being set at 40 km/h.
A survey of traffic incidents involving bikes in Reykjavík reveals some relevant suggestions to improve bike safety. Analysis of incidents revealed a common cause; bikes riding on shared sidewalks in streets with parked cars obscuring their visibility. As the bike intersects from behind parked cars, a car turns into the intersection between parked cars and the vehicles crash into each other. The researcher actually suggests promoting cycling in motor traffic and not on shared sidewalks in order to increase the visibility between drivers and cyclers.
What is the trip speed of s-pedelecs?
S-pedelecs are able to float with car traffic in most urban settings (in Reykjavík, namely streets with 30-50 km/h speed limits). But not many surveys have been done on the speed difference of pedelecs, s-pedelecs and cars. In Sweden one study measured an average speed on regular bikes being 14 km/h and e-bikes at 23 km/h; although their top speeds are similar, it seems that a distribution graph of speeds shows that e-bikes simply help riders accelerate to desired speeds more quickly. A report from Vegagerðin (e. The Icelandic Road and Coastal Administration) cites averages speeds in the capital area — car traffic and public transport at 36 km/h and 22 km/h respectively. Models of traffic projections from Mannvit suggest traffic will slow down over the next years without a modal shift away from cars.
Infrastructure affects trip speed of each modality. Priority lanes, priority flow of traffic at converging streets and safety features can all impact average trip speeds for each modality. In Reykjavík there are planned investments into intersections that give more priority to pedestrian and non-car vehicles. It is worth emphasising that s-pedelecs are currently not allowed to use bike lanes in Reykjavík.
It’s a well documented phenomenon that trip speed in urban settings are not affected as much by vehicle top speed capabilities, but by the volume of traffic at each time (Lamborghini’s are more about social signalling than getting to work quickly). This is why s-pedelecs start to compete with cars — they achieve velocities of urban car trips.
A rep from Smide mentions that their s-pedelecs have been demonstrated to take trips from cars and public transport for this reason:
We also have studies showing that our e-bikes, and that’s also what the city likes about us, actually bring people from the car to the bike. So actually it reduces cars and public transport in the long term.
What about the weather? How does usage and seasonality compare to Zurich?
Many believe that heavy car usage is the result of weather conditions in Reykjavík. This is not true, and a well documented myth. It is actually design decisions of infrastructure that induce the traffic that suits, and is encouraged by, those roads. Many cities with similar climate to Reykjavík have successful bike rentals (Helsinki, Trondheim) and radically less private car traffic in their modal split.
Tires on bikes can be switched to studded ones during winter months.
Liability and insurance
Category II vehicles must be registered, numbered and the riders must be insured for vehicle damage in the case of a collision.
Municipality cooperation
Cities want to understand the effect of dockless e-bikes. Are they replacing car trips? What kind of trips are they? What is the rate of accidents? Are they causing more issues than they are solving?